


Paved paradise, put up a parking lot.
Mapping parking in urban centres

Despite living in possibly the most rural province in Canada, I’m a city dweller and always have been. I’ve lived in three cities across Canada, one each in BC, Ontario, and Saskatchewan. On reflection, each of these cities has many unique qualities, but all have shared a preference for commuting by car and infrastructure that is heavily focused on automobiles. I love cars (especially this one), but this preference for car infrastructure is really noticeable as someone who also loves walking, living a pedestrian lifestyle, and walkable cities in general. When I saw the image below posted on Twitter (I've since lost the link to who posted it so I can’t cite it), it blew my mind to think about how much of urban centres might be dedicated to parking lots. I decided to dig into the data that might be available to see if I could replicate this map and compute the area of downtown used by various land uses. What do you think I’m going to find as the total surface area of Regina’s downtown dedicated to parking?

For land use data, there are open data sources available for most urban centres in Canada and the USA, however, hitting all of these would be a chore if one wanted to do a large scale analysis. So, I turned to OpenStreetMap.org, the wikipedia of online maps. If you’ve ever used a hiking app on your phone, you’ve used openstreetmap. The website operates in a similar manner to wikipedia in that it relies on users to crowd source information - in this case, geographic information. Users upload their own GPS routes and tag buildings and amenities with attributes like “building”, “park”, “highway”, “street-side parking”, etc.
At some point, I’ll write up a Medium article that goes further into the “how” I gathered this data, but for those interested, I’ll point you to this R package that I used to pull data from Open Street Map.
Data accuracy on Open Street Map
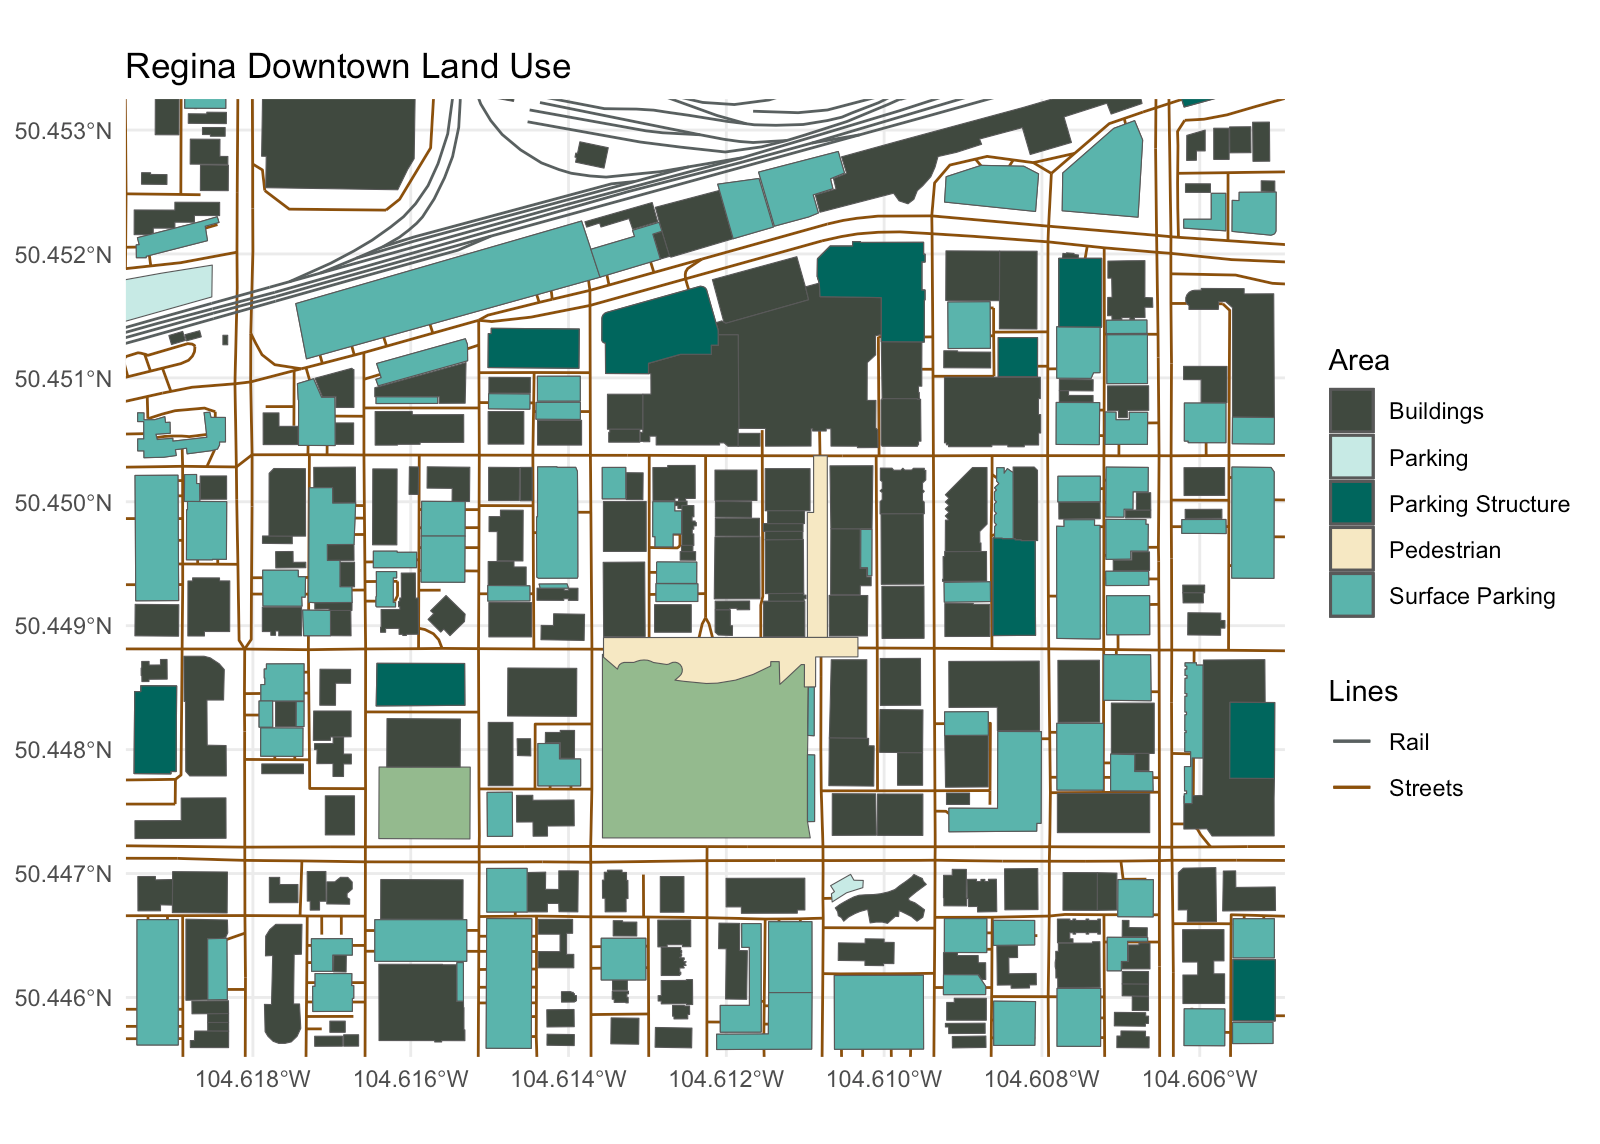
I quickly defined an area of downtown Regina to coincide with what was shown in the image and pulled data on buildings, parks, parking, and pedestrian areas onto my laptop. I knew that I wanted to show both surface parking and parking structures (ie. parkades) so I partitioned the data into features that would show these and it was from there that I noticed an absence of surface parking data in areas where I knew from experience that there were large surface parking lots. I spent a couple hours first learning how to edit OpenStreetMap, and then comparing the data available on the website with satellite imagery and shots from Good Street View. While I loved the ease of accessing data from OpenStreetMap, after seeing the data quality, my hopes of doing a cross-country analysis were tempered. I wouldn’t have the time to spend on each metro area in Canada that I did for the two major centres in Saskatchewan.
Results for Regina
Overall, my analysis shows that parking alone is 20.5% of the surface area of Regina’s downtown. To be honest, this is lower than I expected but still fairly high to think that one fifth of all space in the economic centre of a city would be dedicated to housing idle automobiles. I was pleasantly surprised to find that 4% and 1% of Regina’s downtown is dedicated to parks and pedestrian areas (Scarth Street Mall / Pat’s Plaza), respectively. A full 45% of the city’s downtown land use is categorized as “other”. This would most likely be space allocated to roads, streets, on-street parking, and utilities. See the footnotes at the bottom of this post for a bit more on this if you’re interested.
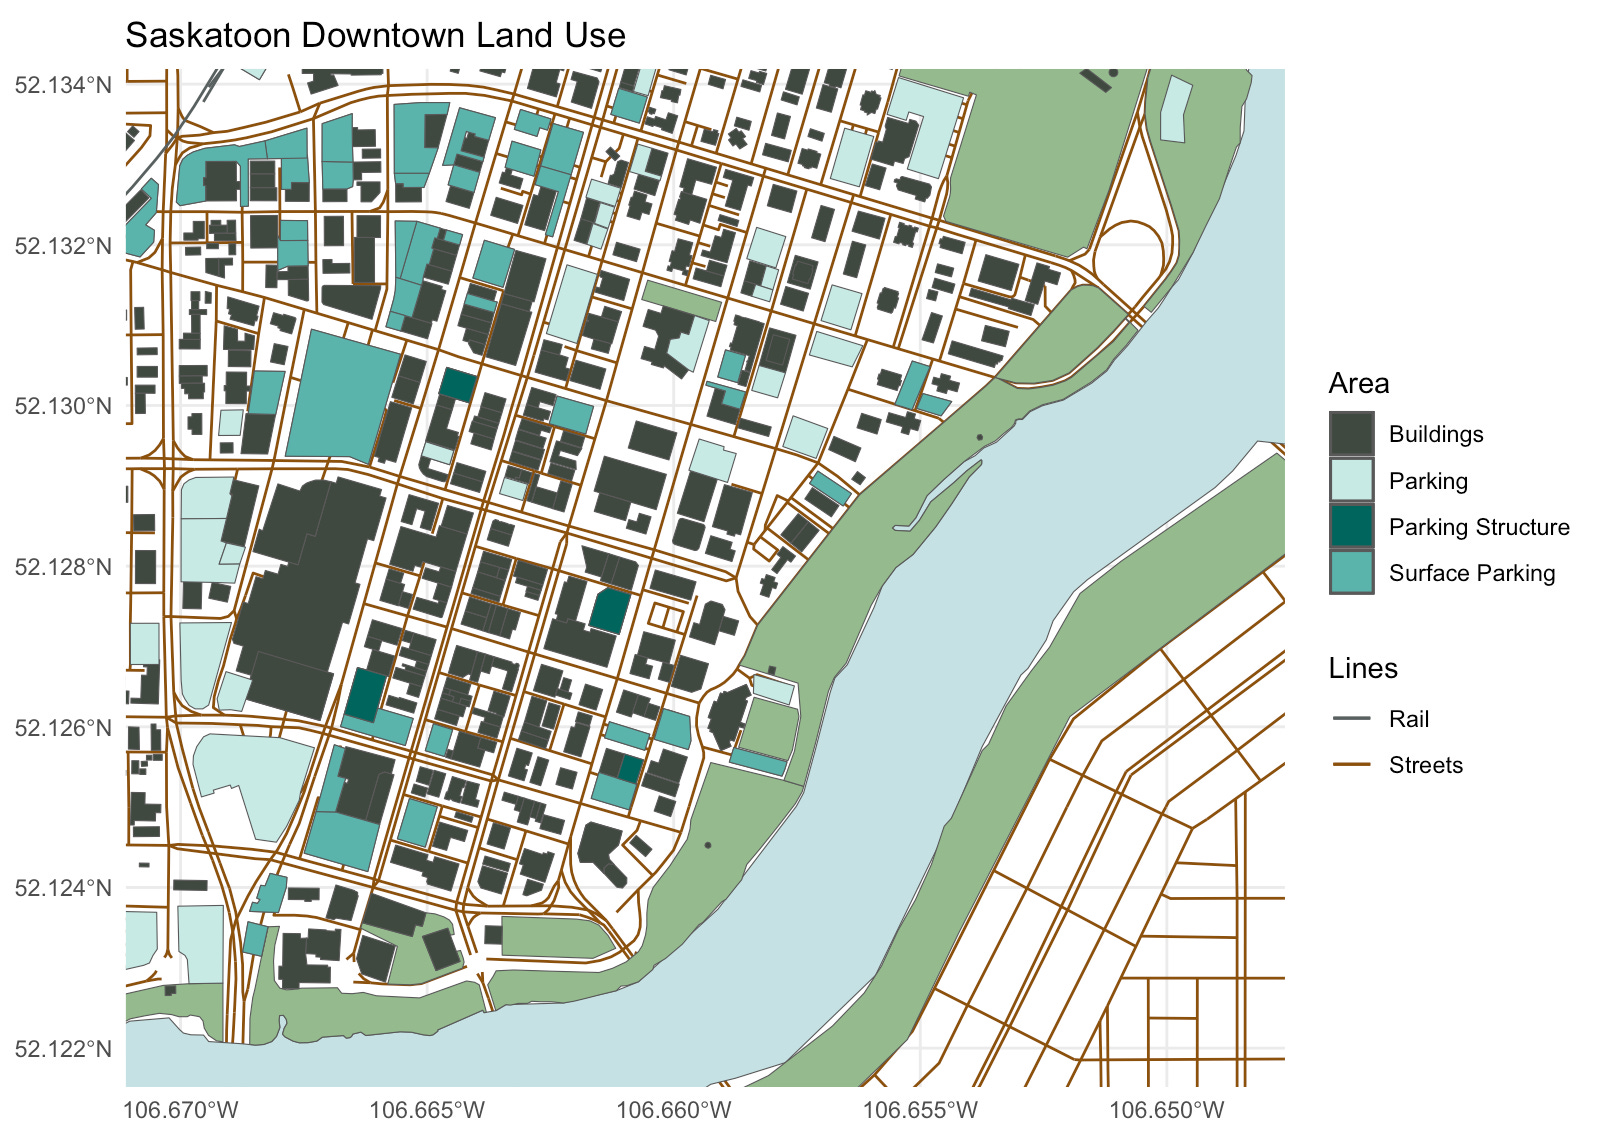
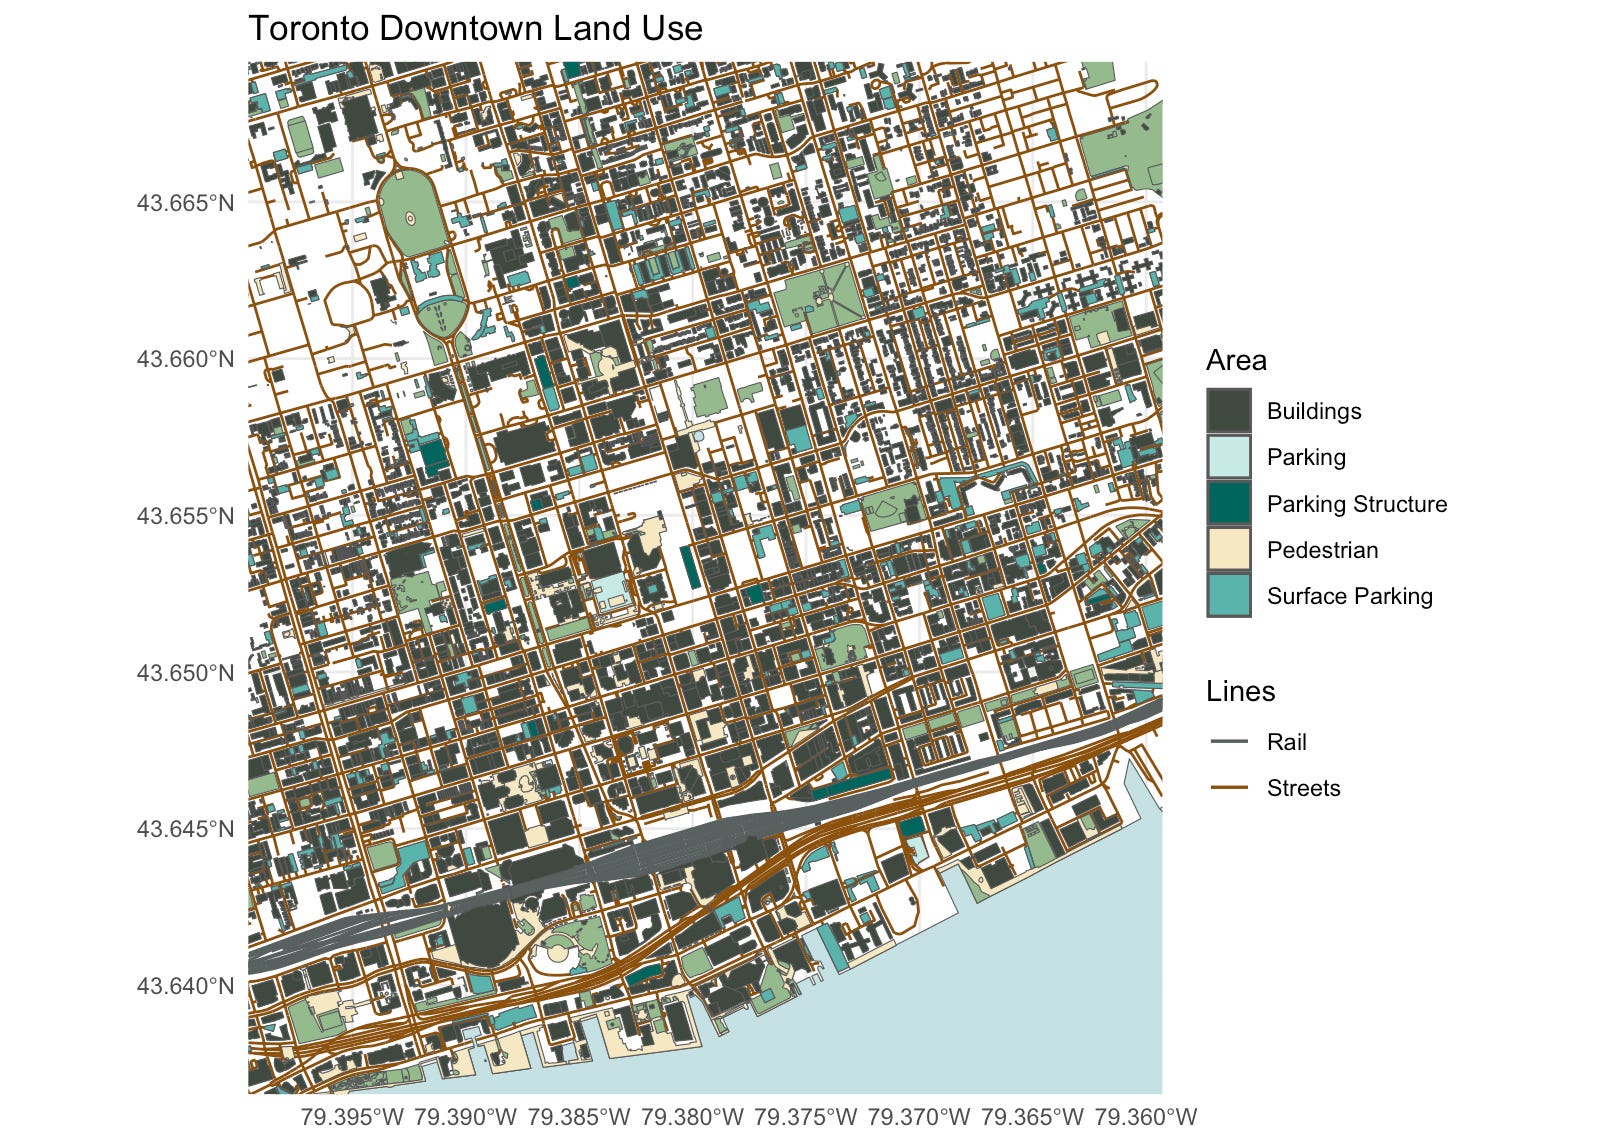
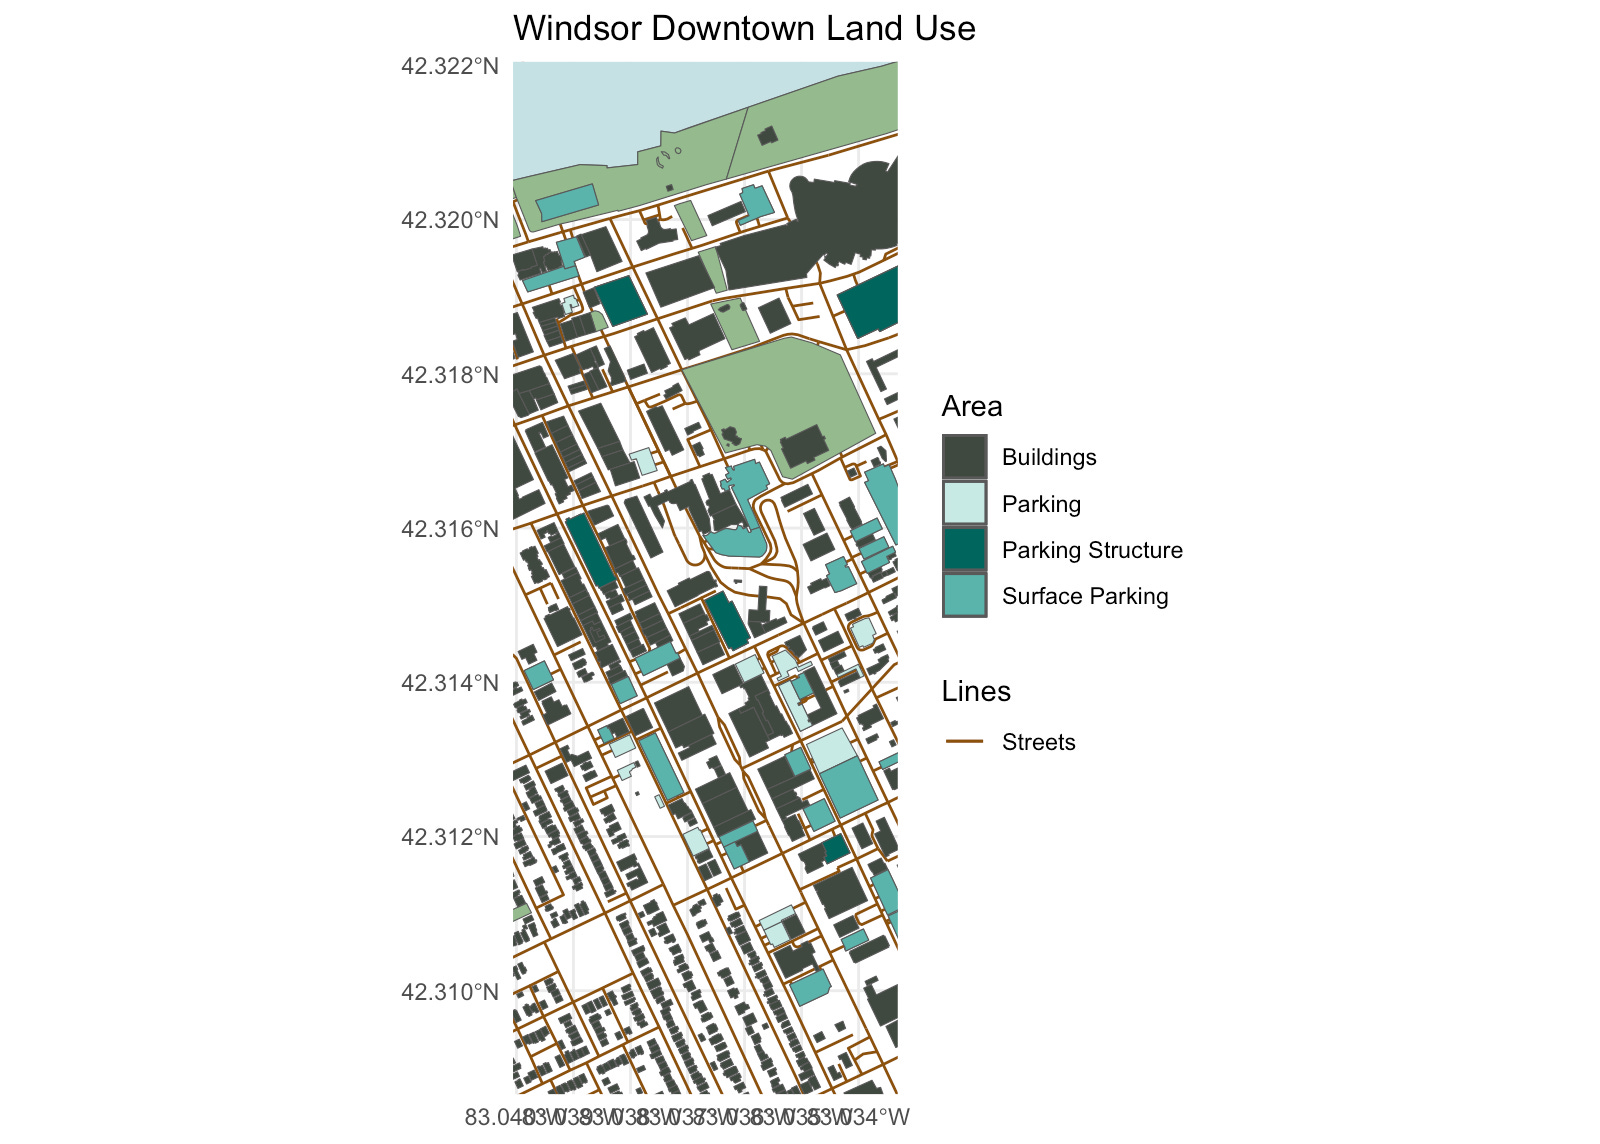
Comparing across Canada
I performed the same process as above with Saskatoon, Vancouver, Toronto, and Windsor. Namely, the process was to:
Define some boundaries for downtown. This is up for interpretation. See footnotes.
Download street map data and review any major gaps where land use is un-tagged.
Log into Open Street Map and tag the land use appropriately. (Note that this is a lot easier for areas I’m more familiar with, so I didn’t do this extensively for areas outside Saskatchewan.

Parting words
I had a bit of fun working with OpenStreetMaps with this post, however, I was left a little disappointed with the analysis as the data quality just wasn’t where I’d hoped. To be fully transparent, I’ve sat on this post for quite a while, coming back to it from time-to-time and picking away at trying to improve the data quality sufficiently or take a different approach to improve things and finally just needed to let this one go so I can move on. Let me know if you have other ideas on how one might approach estimating surface area of land by use in Canada. I’d love to hear from you.
*Footnotes and caveats
This brief analysis showed me is that there are a couple important notes to consider when reading anything into this:
One can likely get close to the land use estimate for parking by manually editing OpenStreetMap and comparing to satellite imagery / Google Street View. However, this does not include land use for roads, which I suspect is a good chunk of the large “other” category when analyzing open street map data. For Regina, 45% of downtown land use was difficult to categorize. There are no estimates of road width in OpenStreetMap and no estimates for sidewalk size either. I’m not aware of good way to estimate the area taken up by roads and streets and open to reader feedback on how this might be accomplished. I’m particularly interested in on-street parking, which would be a fair chunk of land use in many urban centres.
Astute readers would notice that the bounding boxes for downtown are square and likely don’t look like what you might consider to be the downtown area for a given city. This does affect the estimate for land use % and it’s the main reason why I didn’t include values for cities other than Regina, which coincidentally, is the area I’m most familiar with and also looks most like a square, haha. I’m confident that my analysis could be adjusted to allow for a polygon bounding box for the downtown area, however, this would need to be done individually for each city and that would be quite time consuming.